|
In Excel the distance of the galaxy rotation curve is expressed in Units. One unit is identical with one line of information (results) and is equivalent with 1000 Lightyears.
The average radius of a rotation curve is 100 units or 100000 Lightyears or 30 kpc.
The standard distance of the bulge is 6 units or 6000 Lightyears. This distance is defined by the parameter rbulge. Within this range the speed of the rotation curve increases lineair to 250 km/sec. There after the speed is calculated as a function of the density.
The program consists of approximate 6 tests: Test1, Test2, Test3, Test4, Test5 and Test6
Each test has 11 parameters: "NFW", "r bulge", "r disk", "rdisp", "rs" , "rhos", "a", "Mh", "rho disk str", "rho disk end" and "Rd"
In order to start the simulation select START button.
Each simulation consists only of 1 phase. In effect this phase is the same as phase 4 of the Excel programs Circ11.xls, Circ12.xls etc.
In this phase the galaxy rotation curve is calculated as a function of the density of the bulge, the disk and the density of dark matter profile (either NFW or Hernquist).
In the programs Circ11, Circ12 etc the density profile of the disk was calculated based starting from a flat rotation curve (if VSEL = 1). For a description of that program select circ11.xls.htm
In this program grotcexp.xls the density is calculated in two ways:
For readers not familiar with rotation curves select this overview article by Stephen M. Kent:
http://adsbit.harvard.edu/cgi-bin/nph-iarticle_query?bibcode=1987AJ.....93..816K
There is also a PDF version available from that link. Rememember that Andromeda galaxy, M31 and N224 are one and the same.
|
|
| Parameter | Test1 | Test2 | Test3 | Test4 | Test5 | Test6 | Test7 |
| 1 NFW | 1 | 1 | 1 | 1 | 1 | 1 | 1 |
| 2 rbulge | 6000 | 6000 | 6000 | 6000 | 6000 | 6000 | 6000 |
| 3 disk | 110000 | 110000 | 120000 | 120000 | 100000 | 300000 | 400000 |
| 4 NFW rs | 0 | 0 | 0 | 0 | 0 | 0 | 0 |
| 5 NFW rhos | 0 | 0 | 0 | 0 | 0 | 0 | 0 |
| 6 Hq a | 0 | 0 | 0 | 0 | 0 | 0 | 0 |
| 7 Hq MHalo | 0 | 0 | 0 | 0 | 0 | 0 | 0 |
| 8 Rho disk s | 6,94E-11 | 10,5-11 | 6,94E-11 | 8E-11 | 6,94E-11 | 8E-11 | 8E-11 |
| 9 Rho disk e | 2,24E-12 | 3,38E-12 | 4,11E-12 | 4,74E-12 | 6,34E-13 | 5,27E-14 | 4,32E-15 |
| 10 Rd | 30000 | 30000 | 40000 | 40000 | 40000 | 40000 | 40000 |
| 11 Rho NFW | 0 | 0 | 0 | 0 | 0 | 0 | 0 |
| 12 tot m bulge | 5,32 | 5,32 | 5,32 | 5,32 | 5,32 | 5,32 | 5,32 |
| 13 tot m disk | 36,3 | 54,89 | 55,63 | 64,10 | 6,87 | 79,67 | 80,01 |
| 14 tot m dm | 0 | 0 | 0 | 0 | 0 | 0 | 0 |
| 15 max r dm | 0 | 0 | 0 | 0 | 0 | 0 | 0 |
Description of Excel program: Grotcexp1.xls
Test1, Test2, Test3 and Test4
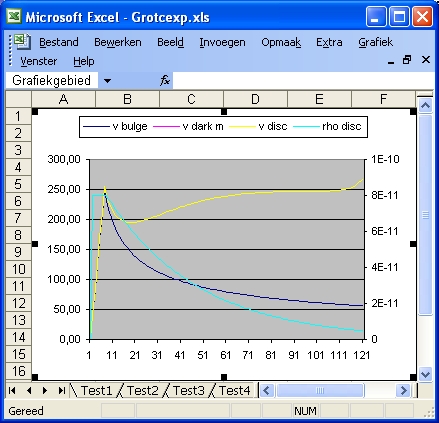
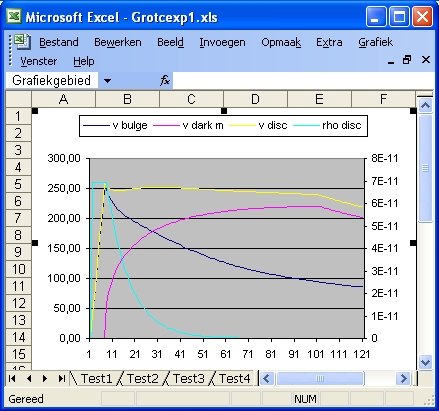
The purpose of the four tests is to simulate the observed flat rotation curve by introducing dark matter and by using the NFW profile.
The amount of visible mass in all simulations is the same i.e the density function parameters "rho disk start", and "Rd" RD are the same.
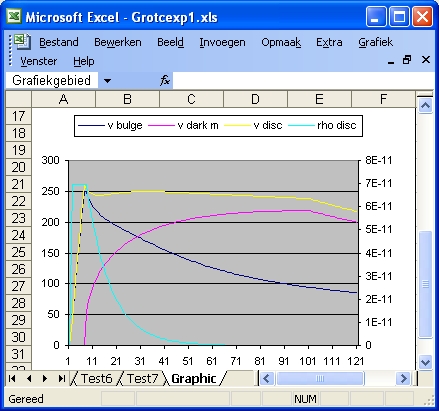
Test5, Test6 and Test7
The purpose of the three tests is to simulate the observed flat rotation curve by introducing dark matter and by using the Hernquist profile.
The density function parameter RD is the same as used in the four tests above.
This result is identical as Test4
Parameters of Excel program Grotcexp.xls
| Parameter | Test1 | Test2 | Test3 | Test4 | Test5 | Test6 | Test7 |
| 1 NFW | 1 | 1 | 1 | 1 | 0 | 0 | 0 |
| 2 rbulge | 6000 | 6000 | 6000 | 6000 | 6000 | 6000 | 6000 |
| 3 disk | 100000 | 100000 | 100000 | 100000 | 100000 | 100000 | 100000 |
| 4 NFW rs | 7500 | 15000 | 30000 | 48000 | 0 | 0 | 0 |
| 5 NFW rhos | 4E-11 | 1E-11 | 3.2E-12 | 1,35E-12 | 0 | 0 | 0 |
| 6 Hq a | 0 | 0 | 0 | 0 | 30000 | 60000 | 96000 |
| 7 Hq MHalo | 0 | 0 | 0 | 0 | 0,4 | 0,85 | 1,35 |
| 8 Rho disk s | 6,94E-11 | 6,94E-11 | 6,94E-11 | 6,94E-11 | 6,94E-11 | 6,94E-11 | 6,94E-11 |
| 9 Rho disk e | 3,12E-12 | 6,63E-13 | 6,34E-15 | 6,34E-15 | 6,34E-15 | 6,34E-15 | 6,34E-15 |
| 10 Rd | 10000 | 10000 | 10000 | 10000 | 10000 | 10000 | 10000 |
| 11 Rho NFW | 1E-11 | 2.5E-12 | 8E-13 | 3,375E-13 | 0 | 0 | 0 |
| 12 tot m bulge | 5,32 | 5,32 | 5,32 | 5,32 | 5,32 | 5,32 | 5,32 |
| 13 tot m disk | 6,87 | 6,87 | 6,87 | 6,87 | 6,87 | 6,87 | 6,87 |
| 14 tot m dm | 159 | 322 | 853 | 1490 | 75 | 164 | 264 |
| 15 max r dm | 17951K | 359021K | 919112K | 1588234K | 6883K | 14193K | 22624K |
What those tests don't tell you is
Back to my home page Contents of This Document