Description of Excel programs:
Circ11.xls, Circ12.xls, Circ13.xls, Circ14.xls, Circ15.xls and Circ16.xls
The purpose of the Excel programs is to calculate the densite profile of a disk in order to simulate flat galaxy rotation curves as a function of distance. The starting point is here the shape of the rotation curve. This is called the target curve. Each galaxy consist of a bulge, a disk and an halo of dark matter. This halo is an option
There is also an Excel program which calculates a rotation curve as a function of the density profile of a disk: grotc.xls and grotcexp.xls. For more details See: grotc.xls and grotcexp.xls
The examples of Circ11.xls, Circ15.xls and Circ16.xls are used to demonstrate rotation curves without dark matter.
The examples of Circ12.xls, Circ13.xls and Circ14.xls are used to demonstrate flat rotation curves with dark matter with two profiles: NFW and Hernquist
- For a copy of the programs in zip format select circ.zip. The Zip file contains all the six programs.
-
All the programs are identical. The difference lies in the parameters of the tests performed.
The main physical assumption is that visible matter and darkmatter behave similar. In this simulation this is Newton's Law for both.
The main problem or chalenge is not to include to much darkmatter, at least such that the darkmatter density should not be higher than the visible matter, because otherwise it will become visible.
The standard radius of a rotation curve is 100000 lightyears or 30 kpc.
The shape of the standard "target" rotation curve (v sel = 1) is such that over the first 3000 lightyears (rbulge = 3000) the speed of the rotation curve increases lineair. There after the speed is constant.
Each program consists of 5 or 6 tests: Test1, Test2, Test3, Test4, Test5 and Test6
Each test has 9 parameters: "NFW", "r bulge", "r disk", "r disp", "v sel", "rs" , "rhos", "a" and "Mh"
- The variable "NFW" or "Hernquist" is used to select the NFW profile or the Hernquist profile.
When "NFW" is 1 the NFW profile is selected. When "Hernquist" is 1 the Hernquist profile is selected.
When "NFW" is 1 and changed to 0 the Hernquist profile is selected. When this is the case the description changes into "Hernquist" and the value into 1.
When "Hernquist" is 1 and changed to 0 the NFW profile is selected. When this is the case the description changes into "NFW" and the value into 1.
- The variable "r bulge" shows the length of the bulge in lightyears. The maximum value is 100000.
- The variable "r disk" shows the length of the disk in lightyears. The maximum value is 200000 lightyears.
- The variable "v sel" identifies the "target" rotation curve. Standard value is 1. The maximum value for "v sel" is 5.
- Page "V SEL" shows the rotation curves for "v sel" values 2 to 4. Additionnal user defined rotation curves can be added.
-
- rs and rhos are two parameters of the NFW dark mattter profile. See http://lanl.arXiv.org/pdf/astro-ph/0301144 page 17 for more details.
- Mh and a are two parameters of the Hernquist dark mattter profile. See http://lanl.arXiv.org/pdf/astro-ph/0506015 page 2 for more details.
In order to start the simulation select START button.
Each simulation consists of 4 phases or passes. When no dark matter is involved (rhos = 0 when NFW = 1 or Mh = 0 when hernquist = 1) the simulation proceeds as follows:
- In pass 1, First the density and the mass of the bulge is calculated as a function of r (within "r bulge") in order to match the rotation curve. The result is stored in column E under "rho bulge" and in column F under "m bulge".
Second the force F1 of the bulge and a test mass as a function of r is calculated.
The disk is divided in a set of rings
Third the force F2 of test mass at distance r for each of the rings at distance rcnt is calculated assuming that density of the disk is 1. The result is stored in a matrix of 100 by 100 as a function of r and rcnt. The solution of this matrix is the density curve of the disk
Fourth a target Force F3 function is calculated. This target Force is equal to a rotating mass at distance xx and is equal to m1 * v *v / xx with v equal to the rotation curve.
Finally a delta Force is calcuted as a function of r. This force is equal to F3 - F1. The result is stored in vsave.
-
In pass 2 The matrix is solved with vsave. The result is stored in column D under "rho calc" and in vsave.
-
In pass 3 a high order lineair equation is calculated to represent the density curve of the disk. The result is stored in column J under "rho disk".
-
In pass 4 first again the force F of the bulge and a test mass as a function of r is calculated. Secondly the force F of each of the rings of the disk mass and a test mass is calculated as a function of r, but now using the density curve. Finally the rotation curve of the whole galaxy is calculated. The result is stored in column I under "v disk".
When dark matter is included in the simulation:
- In the case of NFW = 1 then the parameters rs and rhos are non zero.
- In the case of Hernquist = 1 then the parameters Mh and a are non zero.
Dark matter is assumed outside the radius "r bulge".
In pass 1 the density of the dark matter is calculated using the following formula:
- In the case of NFW = 1:
- rhoNFW = rhos/(r/rs*(1+r/rs)^2)
-
- In the case of hernquist = 1:
- rho = (Mh/2pi*r) * a/(r+a)^3)
-
The result is stored in column E under "rho dark m"
In pass 1 also the dark matter mass is calculated. The result is stored in column F under "m dark m"
For readers not familiar with rotation curves select this overview article by Stephen M. Kent:
http://adsbit.harvard.edu/cgi-bin/nph-iarticle_query?bibcode=1987AJ.....93..816K
There is also a PDF version available from that link. Rememember that Andromeda galaxy, M31 and N224 are one and the same.
Circ11.xls - no dark matter
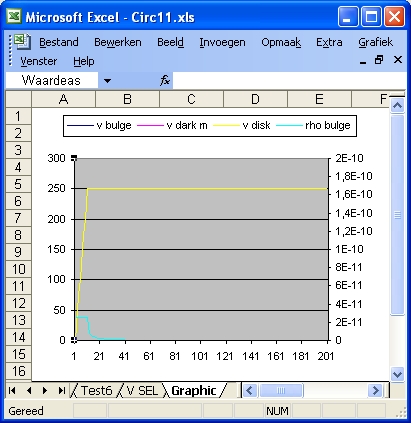
Test1 of Circ11.xls
The purpose of Test1 is to simulate a galaxy with only consists of a bulge. You can compare this with an elliptical galaxy. In this case there is no disk.
The variabele v sel = 1 and r bulge = 200000 Ly.
- Column F shows the mass of the bulge which increases lineair to 200 units. The total mask of the disk is 177,28 * 10^40 Kg
The most important result is in column E which shows the density of the bulge resposible for the flat rotation curve. For the first 10 units the density is constant, decreases sharply at r = 11000 Ly and then decreases slowly.
- This is an interesting result.
The implication is that the bulge becomes "invisible" at higher distances from the centre.
The easiest explanation for this "invisible" bulge is a halo of very small stars or dwarf stars.
- Test1 can also be seen as a simultion of a mixture between a bulge (until r = 10000 Ly) and dark matter (starting from r = 11000 Ly) . In that case Test1 shows the maximum amount of dark matter in order to simulate a flat rotation curve.
 Test 1
|
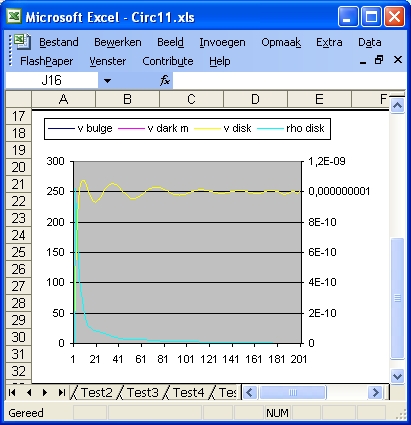
Test2 of Circ11.xls
The purpose of Test2 is to simulate a galaxy with only consists of a disk. That means there is no bulge. In this case the density of the disk represents the maximum values in order to simulate the flat rotation curve. It is important to remember that the total height of the disk is 1000 Ly or 1 unit. That means 0.5 units in both positive and negative directions.
The total mass of the disk is approx. 116 * 10^40 Kg.
The variabele "r bulge" = 0.
Column D shows the true density of the disk. The first value is almost 9.7E-10. This is the maximum density possible. The density at a distance of 10000 Ly or units is close to 1.757E-10. This is an important value for the next three tests.
 Test 2
|
Test3, Test4 and Test6 of Circ11.xls
The purpose of the tests is to simulate different bulge sizes.
- Test3 shows the simulation for the smallest bulge. The variable "r bulge" = 3000 Ly or 3 units. In Test4 this is 6000 Ly and in Test6 10000 Ly.
- Column E shows the density of the bulge. For Test3 the density is: 2.77E-10 For Test4 : 0.69E-10 and for Test6: 0.25E-10
- Column D shows the true density of the disk. For Test3 the density at a distance of 10 units (r = 10000 Ly) is 1.66E-10. For Test4 this value is approx 1.49E-10 and for Test6 0.934E-10
- For each of those tests the sum of the total mass of the bulge and the disk is the same and approximate equal to 116 * 10^40 Kg. This is also the value for Test2
Test4 and Test5 of Circ11.xls
The purpose of Test5 is to simulate a velocity profile which is not flat. (Vsel = 6 and disktype = 1)
In Test4 the galaxy rotation curve is flat (Vsel = 1)
- The parameter "r bulge" in both tests is 6000 Ly.
- The total mass of the bulge and the disk in Test4 is 116 * 10^40 Kg. In Test5 the total mass = 17 * 10^40 Kg
Test5 represents a Galaxy Rotation curve based on the observed visible mass. Test4 represents the observed Galaxy Rotation curve, which is flat. Test4 demonstrates how much mass is required to support a flat Galaxy Rotation Curve assuming that there is a only a bulge and a disk. That means roughly (116-17) or 98*10^40 Kg mass is missing.
The current excepted explanation is that this missing mass is not solely in the disk but also outside the disk (in a halo) in the form of dark matter.
Parameters of Excel program Circ11.xls - No darkmatter
| Parameter |
Test1 |
Test2 |
Test3 |
Test4 |
Test5 |
Test6 |
| 1 NFW |
1 |
1 |
1 |
1 |
1 |
1 |
| 2 rbulge |
200000 |
0 |
3000 |
6000 |
6000 |
10000 |
| 3 disk |
200000 |
200000 |
200000 |
200000 |
200000 |
200000 |
| 4 rdisp |
200000 |
200000 |
200000 |
200000 |
200000 |
200000 |
| 5 Vsel |
1 |
1 |
1 |
1 |
6 |
1 |
| 6 NFW rs |
0 |
0 |
0 |
0 |
0 |
0 |
| 7 NFW rhos |
0 |
0 |
0 |
0 |
0 |
0 |
| 8 Hq a |
0 |
0 |
0 |
0 |
0 |
0 |
| 9 Hq MHalo |
0 |
0 |
0 |
0 |
0 |
0 |
| 10 tot m bulge |
177,286 |
0 |
2,659 |
5,318 |
5,318 |
8,864 |
| 11 tot m disk |
0.0 |
115,95 |
113,497 |
110,708 |
17,719 |
107,554 |
| 12 tot m dm |
0.0 |
0.0 |
0.0 |
0.0 |
0.0 |
0.0 |
| 13 max r dm |
0.0 |
0.0 |
0.0 |
0.0 |
0.0 |
0.0 |
Circ12.xls - NFW profile
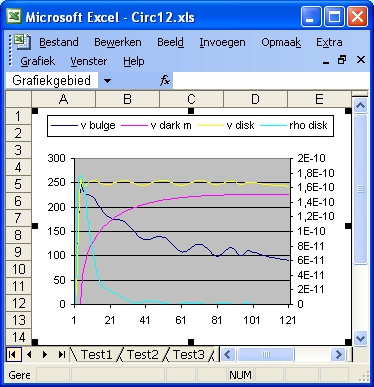
Test1 to Test6 of Circ12.xls
The 6 tests are used to demonstrate the influence of darkmatter with the NFW profile.
The difference between the 6 test is only in the values of the two parameters rs and rhos.
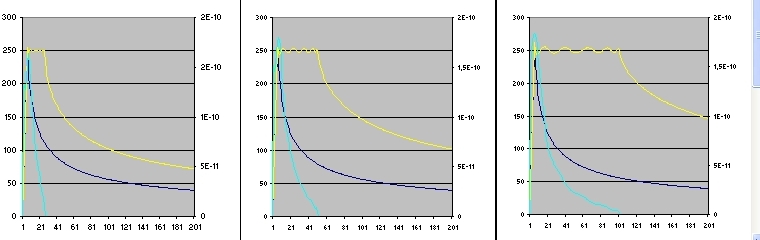
- The purpose of the tests 1-3 is to keep the parameter rs small and constant and to increase the parameter rhos. The result is that the dark matter peak stays constant but the height increases.
- The purpose of the tests 3-6 is to increase the parameter rs. The result is that the dark matter peak moves to the right. The parameter rhos is adjusted such that the maximum height of the bulge does not change.
- Test6 is important because this simulation demonstrates how much dark matter is required to explain the difference between the rotation curve calculated based on the observed visible mass (the dark blue line) versus the observed rotation curve (which is flat).
It should be mentioned that the total amount of darkmatter involved is hugh and equal to 1.461 * 10^43 Kg
- In Test3 the observed rotation curve is also flat but the calculated rotation curve based on the observed visible mass (the dark blue line) is wrong.
- One important density value to study is the "rho dark matter" value just outside the bulge. This is the value in column "E" at a distance of 4000 Ly (unit 4)
This value is Test1: 5.787E-12 Test2: 2.81E-11 Test3: 6.55864E-11 Test 4: 3.01E-11 Test 5: 2E-11 and Test6: 1.5E-11
The value of Test3 is the highest dark matter value. The values to compare with are in column "D" (real disk density) or in column "J" (disk density function). Those values represent visible matter and are lower. This raises a possible conflict, because the dark matter density values are higher than the visible matter density values.
 Test 6
|
Parameters of Excel program Circ12.xls - NFW model
| Parameter |
Test1 |
Test2 |
Test3 |
Test4 |
Test5 |
Test6 |
| 1 NFW |
1 |
1 |
1 |
1 |
1 |
1 |
| 2 rbulge |
3000 |
3000 |
3000 |
3000 |
3000 |
3000 |
| 3 disk |
100000 |
100000 |
100000 |
100000 |
100000 |
100000 |
| 4 rdisp |
120000 |
120000 |
120000 |
120000 |
120000 |
120000 |
| 5 Vsel |
1 |
1 |
1 |
1 |
1 |
1 |
| 6 NFW rs |
5000 |
5000 |
5000 |
18000 |
30000 |
45000 |
| 7 NFW rhos |
15E-12 |
73E-12 |
170E-12 |
10E-12 |
3,5E-12 |
1,6E-12 |
| 8 Hq a |
0 |
0 |
0 |
0 |
0 |
0 |
| 9 Hq MHalo |
0 |
0 |
0 |
0 |
0 |
0 |
| 10 tot m bulge |
2,659 |
2,659 |
2,659 |
2,659 |
2,659 |
2,659 |
| 11 tot m disk |
52,32 |
41,618 |
23,713 |
13,781 |
11,443 |
10,00 |
| 12 tot m dm |
14,081 |
83,889 |
214,469 |
582,43 |
943,46 |
1461,88 |
| 13 max r dm |
19937K |
97066K |
226059K |
620405K |
1005284K |
1551013K |
| 14 max "D" |
3,00E-10 |
1,92E-10 |
1,32E-11 |
3,01E-11 |
1,67E-10 |
1,94E-10 |
| 15 max "E" dm |
5,78E-12 |
2,81E-11 |
6,55E-11 |
2,04E-11 |
2,04E-11 |
1,51E-10 |
Circ13.xls - Hernquist
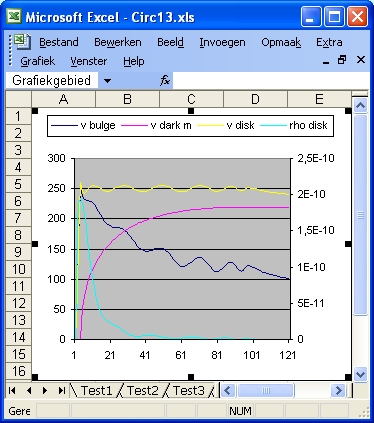
Test1 to Test6 of Circ13.xls
The 6 tests are used to demonstrate the influence of darkmatter with the Hernquist profile.
- The purpose of the tests 1-6 is to keep the parameter a small and constant and to increase the parameter Mh. The result is that the dark matter peak stays constant but the height increases.
- The importance of this test is to compare the maximum density of the disk with the maximum darkmatter density value. This means the values in column "D" with the values in column "E", specific the value at unit 4 or 4000 Ly.
The results are stored behind the results 14 and 15 in the table below.
The results of test5 are the same, meaning that the ordinary matter density and the darkmatter density are the same. For test6 darkmatter density is even higher. This raises a problem because it means that may be certain combinations the parameters "a" and "Mh" are not allowed.
 Test 6
|
Parameters of Excel program Circ13.xls - Hernquist model - Mh var
| Parameter |
Test1 |
Test2 |
Test3 |
Test4 |
Test5 |
Test6 |
| 1 Hernquist |
1 |
1 |
1 |
1 |
1 |
1 |
| 2 rbulge |
3000 |
3000 |
3000 |
3000 |
3000 |
3000 |
| 3 disk |
100000 |
100000 |
100000 |
100000 |
100000 |
100000 |
| 4 rdisp |
120000 |
120000 |
120000 |
120000 |
120000 |
120000 |
| 5 Vsel |
1 |
1 |
1 |
1 |
1 |
1 |
| 6 NFW rs |
0 |
0 |
0 |
0 |
0 |
0 |
| 7 NFW rhos |
0 |
0 |
0 |
0 |
0 |
0 |
| 8 Hq a |
3000 |
3000 |
3000 |
3000 |
3000 |
3000 |
| 9 Hq MHalo |
0,004 |
0,012 |
0,025 |
0,05 |
0,1 |
0,15 |
| 10 tot m bulge |
2,659 |
2,659 |
2,659 |
2,659 |
2,659 |
2,659 |
| 11 tot m disk |
54,68 |
53,862 |
52,528 |
49,962 |
48,831 |
40,229 |
| 12 tot m dm |
0,493 |
1,504 |
3,158 |
6,348 |
12,743 |
19,144 |
| 13 max r dm |
215K |
375K |
543K |
770K |
1091K |
1337K |
| 14 max "D" |
3,16E-10 |
2,94E-10 |
2,57E-10 |
1,87E-10 |
8,35E-11 |
5,40E-11 |
| 15 max "E" dm |
3,28E-12 |
9,86E-12 |
2,05E-11 |
4,11E-11 |
8,22E-11 |
1,23E-10 |
Circ14.xls - Hernquist
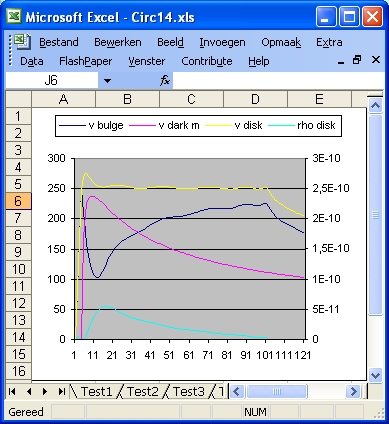
Test1 to Test6 of Circ14.xls
The 6 tests are used to demonstrate the influence of darkmatter with the NFW profile.
The difference between the 6 test is only in the values of the two parameters a and Mh (Mass Halo).
- The purpose of the tests 1-3 is to keep the parameter a small and constant and to increase the parameter Mh. The result is that the dark matter peak stays constant but the height increases.
- The purpose of the tests 3-6 is to increase the parameter a. The result is that the dark matter peak moves to the right. The parameter Mh is adjusted such that the maximum height of the bulge does not change.
- Test6 is important because this simulation demonstrates how much dark matter is required to explain the difference between the rotation curve calculated based on the observed visible mass (the dark blue line) versus the observed rotation curve (which is flat).
It should be mentioned that the total amount of darkmatter involved is large and equal to 2.64 * 10^42 Kg
- In Test3 the observed rotation curve is also flat but the calculated rotation curve based on the observed visible mass (the dark blue line) is wrong.
- One important density value to study is the "rho dark matter" value just outside the bulge. This is the value in column "E" at a distance of 4000 Ly (unit 4)
This value is Test1: 1,691E-11 Test2: 4.51E-11 Test3: 8.74E-11 Test4: 4.11E-11 Test5: 1.93E-11 and Test6: 1.21E-11
The value of Test3 is the highest dark matter value. The values to compare with are in column "D" (real disk density) or in column "J" (disk density function). Those values represent visible matter and are lower. This raises a conflict, because the dark matter density values are higher than the visible matter density values.
 Test 6
|
Parameters of Excel program Circ14.xls - Hernquist model
| Parameter |
Test1 |
Test2 |
Test3 |
Test4 |
Test5 |
Test6 |
| 1 Hernquist |
1 |
1 |
1 |
1 |
1 |
1 |
| 2 rbulge |
3000 |
3000 |
3000 |
3000 |
3000 |
3000 |
| 3 disk |
100000 |
100000 |
100000 |
100000 |
100000 |
100000 |
| 4 rdisp |
120000 |
120000 |
120000 |
120000 |
120000 |
120000 |
| 5 Vsel |
1 |
1 |
1 |
1 |
1 |
1 |
| 6 NFW rs |
0 |
0 |
0 |
0 |
0 |
0 |
| 7 NFW rhos |
0 |
0 |
0 |
0 |
0 |
0 |
| 8 Hq a |
6000 |
6000 |
6000 |
24000 |
60000 |
96000 |
| 9 Hq MHalo |
0,03 |
0,08 |
0,155 |
0,4 |
0,9 |
1,35 |
| 10 tot m bulge |
2,659 |
2,659 |
2,659 |
2,659 |
2,659 |
2,659 |
| 11 tot m disk |
51,591 |
45,754 |
37,086 |
19,346 |
10,604 |
12,709 |
| 12 tot m dm |
4,721 |
12,677 |
24,637 |
75,625 |
175,35 |
264,81 |
| 13 max r dm |
840000 |
1377000 |
1920000 |
6161000 |
14607000 |
22624000 |
Circ15.xls with VSEL
Test1 to Test6 of Circ15.xls
The purpose of this program is to test different galaxy rotation curves. See Page V SEL for the different curves. The curves are calculated via the button INITIAL. The parameter rbulge of page "V SEL" should be the same as the Test if "V SEL" = 2 or greater
- For Test1 "V SEL" = 1. For Test2 "V SEL" = 2 etc. For Test6 "V SEL" = 6.
- The total mass disk value is resp: 6118, 5079, 4140, 3302, 2565 and 1995. What this means is that, if you want to straigten the rotation curve (Starting from "V SEL" = 6) not so much visible matter is required. At least much less mass compared to dark metter in the case of the Hernquist profile and the NFW profile (which is the worst).
Parameters of Excel program Circ15.xls - No Dark Matter - Vsel
| Parameter |
Test1 |
Test2 |
Test3 |
Test4 |
Test5 |
Test6 |
| 1 NFW |
1 |
1 |
1 |
1 |
1 |
1 |
| 2 rbulge |
8000 |
8000 |
8000 |
8000 |
8000 |
8000 |
| 3 disk |
100000 |
100000 |
100000 |
100000 |
100000 |
100000 |
| 4 rdisp |
120000 |
120000 |
120000 |
120000 |
120000 |
120000 |
| 5 Vsel |
1 |
2 |
3 |
4 |
5 |
6 |
| 6 NFW rs |
0 |
0 |
0 |
0 |
0 |
0 |
| 7 NFW rhos |
0 |
0 |
0 |
0 |
0 |
0 |
| 8 Hq a |
0 |
0 |
0 |
0 |
0 |
0 |
| 9 Hq MHalo |
0 |
0 |
0 |
0 |
0 |
0 |
| 10 tot m bulge |
7,091 |
7,031 |
6,971 |
6.911 |
6,852 |
6,792 |
| 11 tot m disk |
50,82 |
34,248 |
20,937 |
12,297 |
8,078 |
5,508 |
| 12 tot m dm |
0.0 |
0.0 |
0.0 |
0.0 |
0.0 |
0.0 |
| 13 max r dm |
0.0 |
0.0 |
0.0 |
0.0 |
0.0 |
0.0 |
Circ16.xls - No darkmatter
Test1, Test2, Test3 and Test4 of Circ16.xls
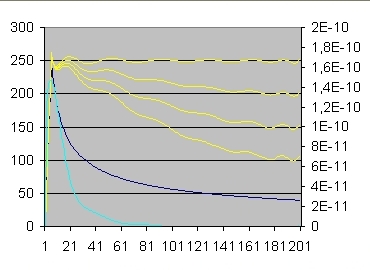
The purpose of the tests is to demonstrate how much matter is required to support flat galaxy rotation curve with different disk sizes. The size of the disk in Test1 is 25 units, of Test2: 50 units of Test3: 100 units. and of Test4: 200 units.
The mass required is roughly: 10, 24, 53 and 111 * 10^40 Kg.
The numbers show almost a lineair increase with distance. What that means is that mass far away (in its outer limits) is as much important as nearby.
 Test1, Test2 and Test3
|
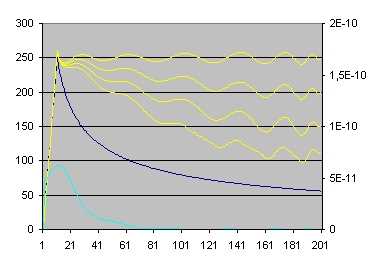
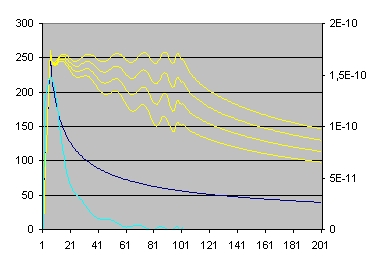
Test4, Test5, Test6 and Test7 of Circ16.xls
- The primary purpose of the Test5, Test6 and Test6 is to calculate the rotation curve and based on the observed amount of visible matter. More strictly: luminosity
The parameter VSEL for those three tests is respectivily: 2, 3 and 4
The final velocity values for those three tests are respectivily: 200, 150 and 100 km/sec.
The "disktype" used is 3.
- The secondary purpose of Test5, Test6 and Test7 is to calculate how much mass is required if you make the galaxy rotation curve more flat.
The mass value to support the flat galaxy rotation curve (v = 250 km/sec) of Test4 is 111 * 10^40 Kg.
The mass values for the Test5, Test6 and Test7 are resp 77, 44 and 22 * 10^40 Kg.
That means respectivily that 34, 64 and 89 *10^40 Kg is missing.
 Test 4 (top yellow line), 5, 6 and 7 (bottom yellow line)
|
For a typical example which demonstrates the difference of a galaxy rotation curve expected from visible matter and which is observed see this:
Galactic Rotation Curves
You can compare that with the test4 versus test5. That means roughly 30% is missing.
You can postulate that this is caused by darkmatter.
Much simpler is the solution that it is ordinary matter caused by planet sized invisible objects
Parameters of Excel program Circ16.xls - No dark matter
| Parameter |
Test1 |
Test2 |
Test3 |
Test4 |
Test5 |
Test6 |
Test7 |
| 1 NFW |
1 |
1 |
1 |
1 |
1 |
1 |
1 |
| 2 rbulge |
5000 |
5000 |
5000 |
5000 |
5000 |
5000 |
5000 |
| 3 disk |
25000 |
50000 |
100000 |
200000 |
200000 |
200000 |
200000 |
| 5 Vsel |
1 |
1 |
1 |
1 |
2 |
3 |
4 |
| 10 tot m bulge |
4,43 |
4,43 |
4,43 |
4,43 |
4,43 |
4,43 |
4,43 |
| 11 tot m disk |
10,18 |
24,52 |
53,37 |
111,57 |
74,01 |
44,15 |
22,58 |
| 12 rho bulge |
0,999E-10 |
0,999E-10 |
0,999E-10 |
0,999E-10 |
0,999E-10 |
0,999E-10 |
0,999E-10 |
| 13 rho disk |
1,641E-10 |
1,795E-10 |
1,839E-10 |
1,878E-10 |
1,728E-10 |
1,591E-10 |
1,466E-10 |
Parameters of Excel program Circ161.xls - No dark matter
Excel program Circ161.xls is almost identical as Excel program Circ16.xls.
The only difference is the size of the bulge which is twice as large.
| Parameter |
Test1 |
Test2 |
Test3 |
Test4 |
Test5 |
Test6 |
Test7 |
| 1 NFW |
1 |
1 |
1 |
1 |
1 |
1 |
1 |
| 2 rbulge |
10000 |
10000 |
10000 |
10000 |
10000 |
10000 |
10000 |
| 3 disk |
25000 |
50000 |
100000 |
200000 |
200000 |
200000 |
200000 |
| 5 Vsel |
1 |
1 |
1 |
1 |
2 |
3 |
4 |
| 10 tot m bulge |
8,86 |
8,86 |
8,86 |
8,86 |
8,86 |
8,86 |
8,86 |
| 11 tot m disk |
6,62 |
20,51 |
49,14 |
107,25 |
69,96 |
40,49 |
20,88 |
| 12 rho bulge |
0,250E-10 |
0,250E-10 |
0,250E-10 |
0,250E-10 |
0,250E-10 |
0,250E-10 |
0,250E-10 |
| 13 rho disk |
0,676E-10 |
0,861E-10 |
0,927E-10 |
0,945E-10 |
0,825E-10 |
0,717E-10 |
0,620E-10 |
 Circ161
|
Parameters of Excel program Circ162.xls - No dark matter
Excel program Circ161.xls is almost identical as Excel program Circ16.xls. The only difference is the size of the size of the disk considered in the case of Test4, Test5, Test6 and Test7 which is 100000 (instead of 20000).
The results show that the amounts of missing matter is slightly smaller.
| Parameter |
Test1 |
Test2 |
Test3 |
Test4 |
Test5 |
Test6 |
Test7 |
| 1 NFW |
1 |
1 |
1 |
1 |
1 |
1 |
1 |
| 2 rbulge |
5000 |
5000 |
5000 |
5000 |
5000 |
5000 |
5000 |
| 3 disk |
25000 |
50000 |
100000 |
100000 |
100000 |
100000 |
100000 |
| 5 Vsel |
1 |
1 |
1 |
1 |
2 |
3 |
4 |
| 10 tot m bulge |
4,43 |
4,43 |
4,43 |
4,43 |
4,43 |
4,43 |
4,43 |
| 11 tot m disk |
10,18 |
24,52 |
53,37 |
53,40 |
41,30 |
30,77 |
22,03 |
| 12 rho bulge |
0,999E-10 |
0,999E-10 |
0,999E-10 |
0,999E-10 |
0,999E-10 |
0,999E-10 |
0,999E-10 |
| 13 rho disk |
1,641E-10 |
1,795E-10 |
1,839E-10 |
1,838E-10 |
1,709E-10 |
1,588E-10 |
1,474E-10 |
 Circ162
|
Page "V SEL"
Introduction
Page "V SEL" is divided into two parts:
- The left part is used to calculate galaxy rotation curves.
The left part consists of 5 columns marked:
- "VSEL = 2", "VSEL = 3", "VSEL = 4", "VSEL = 5" and VSEL = 6
-
Each of those colums shows a user defined target rotation curves for r going from 0 to R disk in Lightyears in increments of 1000 Lightyears.
To perform the calculations select INITIAL.
- The right part is used to calculate the NFW profile or the Hernquist profile.
The right part consists of 4 columns marked:
- "rho bulge/disk", "mass bulge/disk", "rho dark matter", and "mass dark matter"
-
To perform the calculations select: NFW.
Operation page V SEL - The left part
- In order to calculate the Rotation Curves 3 parameters are important:
- R bulge, R disk and Disk type
-
- R bulge defines the distance of the bulge for All curves. The Standard value is 6000 Lightyears or 6 Units.
The calculated curve from 0 to R bulge is lineair going from 0 to 250 km/sec
- R disk defines the maximum distance of the disk. The standard value is 100000 Lightyears or 100 Units.
- Disk type defines the shape of the velocity curve. The are 4 velocity curves.
- For more detail see: program2 - Disktype 1-4
-
- There is one more very important issue and that is that each of the curves requires two parameters:
- A value at R bulge and a value at R disk. These are the two lines in Yellow.
- The value at R bulge is standard 250 km/sec
- The value at R disk should be lower. In most cases for the 5 selection curves the values are: 200, 150, 100, 50 and 0 km/sec
- A button INITIAL. This button is used to calculate the 5 target rotation curves. In order to calculate select INITIAL.
Operation page V SEL - The Right part
In order to calculate a darkmatter profile 10 parameters are important:
- NFW/Hernquist,
R bulge, R disk, rs, rhos, a, Mh,
rho disk start, rho disk end and Filter
-
- NFW/Hernquist defines the profile.
When NFW = 1 or Hernquist = 0 the NFW profile is calculated.
When Hernquist = 1 or NFW = 0 the NFW profile is calculated.
- R bulge defines the distance of the bulge for All curves. The Standard value is 6000 Lightyears or 6 Units.
The calculated curve from 0 to R bulge is lineair going from 0 to 250 km/sec
- R disk defines the maximum distance of the disk. The standard value is 100000 Lightyears or 100 Units.
- rs and rhos are two parameters for the NFW profile.
- a and MH are two parameters for the Hernquist profile. MH means Mass Halo
- rho disk start, rho disk end and Filter are three parameters to define the density profile of the disk.
Smallest value parameter Filter is 0.01
A button NFW. In order to calculate a new profile select: NFW.
Example 1 - Circ12.xls Test3
Program Circ12.xls is used to demonstrate the NFW profile.
Page "V SEL" demonstrates Test3. The parameters rs and rhos are respectivily 5000 and 1.7E-10
In order to demonstrate Test3 the parameter Filter should be 3.
Important: Before doing the calculation set the parameter rho disk start equal to zero.
Example 1 - Circ13.xls Test5
Program Circ12.xls is used to demonstrate the Hernquist profile.
Page "V SEL" demonstrates Test5. The parameters a and Mh are respectivily 3000 and 0.1
In order to demonstrate Test5 the parameter Filter should be 8.
Important: Before doing the calculation set the parameter rho disk start equal to zero.
Reflection part 1
- One of the simulations discussed above "Test2 of Circ11.xls" is a galaxy with only a flat disk. This simulation is not realistic. On the other hand it gives information how much mass there should be in the bulge if you squeeze the bulge to the same height of the disk i.e. 0.5 units.
- The document "General Relativity Resolves Galactic Rotation Without Exotic Darkmatter by F.I. Cooperstock and S. Tieu http://lanl.arXiv.org/pdf/astro-ph/0507619 does exactly the same. If you compare the density functies of page 9 and 12 of that document with the density functions Test2 of Circ11.xls and Test3 of Circ15.xls you will see that they match. This will start you thinking: Maybe there is no dark matter required at all to simulate flat galaxy rotation curves.
- One of the simulations discussed above "Test1 of Circ11.xls" is a galaxy which consists only of a bulge and has darkmatter. This simulation is very realistic because it reflects an elliptical galaxy which supposedly does not contain darkmatter. For more information See: http://universe.gsfc.nasa.gov/press/2003/030409d.html
- All the other galaxies are mixtures of those two extremes.
The three main questions to answer are:
- what is the size of the visible bulge, including planet size objects.
- what is the minimal density of the visible bulge, including planet size objects.
- what is the maximum density of dark matter.
The bulge consists of three sections.
- The first section or central part is around the centre of the galaxy. In this section the density is supposed to be constant. The speed of the rotation curve increases almost lineair.
- The second section is a sphere around the central part. In this layer the density decreases until the bulge becomes invisible.
- The third section is the area outside the visible part of the bulge. The third section reaches until the outside border of the visible disk. This is the parameter "r disk". In this area are the globular clusters. This area contains dark matter. The question is how much.
- You can also define a fourth section, which is not part of the bulge. The fourth section or sphere starts outside the parameter "r disk" and contains dark matter. Again the question is how much.
- The consequence of the first section of the bulge is that the speed of the rotation curve increases lineair.
- The consequence of the second section of the bulge is that this increase levels off and finally stops.
The most important question to ask is how large is (i.e. what is the radius of) this section. The longer this section the less mass is required for the disk. You can see the significance by comparing Test3 (r bulge=3) with Test4 (r bulge = 6)
- You can argue that section 3 with the globular clusters does not belong to the bulge. That is true. But this is not so important. The true question to ask is how many small stars are there in the sphere outside the bulge and the disk, which are not individual visible. This number can be relative small, but its significance can be large. The maximum situation is demonstrated in Test1 when there is no disk.
There are three problems with the Dark Matter simulations of Circ12.xls:
- When rs is small the rhoNFW dark matter values for small values of r are only slightly smaller as the "rho disk" values. That means the dark matter halo is visible, which it should not.
This implies that the supposed dark matter halo becomes an extension of the bulge.
- When rs is large in Test5 at r = 4 "rho dm" is 0.09 (0.0) and "rho disk" is 1.95 (2.8). The values in brackets are for Test1
At r = 20 "rho dm" is 0.014 (0.0) and "rho disk" is 0.25 (0.68).
At r = 35 "rho dm" is 0.005 (0.0) and "rho disk" is 0.09 (0.36).
At r = 50 "rho dm" is 0.0027 (0.0)) and "rho disk" is 0.056 (0.23)
That means only for larger values of r "rho disk" decreases.
- The most important question to answer is which density is still visible en which density value is invisible.
In the above "rho dm" at r=4 is identical as "rho disk" at r=35. The first density should be invisible and the second density should be visible. This is difficult to understand.
The same problem is also mentioned in Test4a above.
Reflection part 2
- The two most important tests are Test 1 of Circ11.xls and Test 2 of Circ11.xls.
The first one simulates a flat rotation curve when there is only a bulge. You could also say when there is only a spherical halo.
The second one simulates a flat rotation curve when there is only a flat disk. This is is the most realistic. The issue of course is here the height of the disk.
-
When you do a simulation you must always include all the mass of the disk. It is "wrong" to stop a simulation at a certain radius r if you know that more disk mass is available outside r. The reason is that the disk mass outside r effects the rotation curve of the disk inside r.
For dark matter assuming that dark matter is uniform spherical distributed does not have this problem because all mass within a certain radius can be considerd as situated at the centre and all mass outside has no influence.
Technical Information
Created: 30 August 2003
Updated: 10 September 2003
Updated: 30 November 2005
Updated: 20 June 2011
Back to my home page Contents of This Document