VB2019 Simultion of our Galagy, including Sagittarius and 10 Large Stars
Contents
Reflection
1. Introduction and Purpose
The purpose of the program "VB Sagittarius" is to simulate the black hole Sagittarius A* and 10 large stars:
See also:
-
4.4 Example of type 2 experiment: The Star s2 around the BH Sagittarius A*
- https://en.wikipedia.org/wiki/Sagittarius_A*
- https://en.wikipedia.org/wiki/S2_(star)
This program is part of what is called the "Sagitarrius Project". To read more select this link
Sagittarius Project
To study part of the problems encountered during this project, pleasy study this: Carpe Diem and Sagittarius.
To study the previous version: VB2019 Sagittarius.program.old.htm.
2. Program Description
The program consists of 4 Forms: Control, Display, Menu and Figure
- The Control Form is used to select a planet simulation and to perform a simulation.
- The Display Form shows the results of a simultion and the result of a simulation saved in a Data Bae
- The Menu Form is to select additional parameters used by a BH simulation
- The Figure Form is to select a simulation saved in a Data Base
3. Control Form - Operation
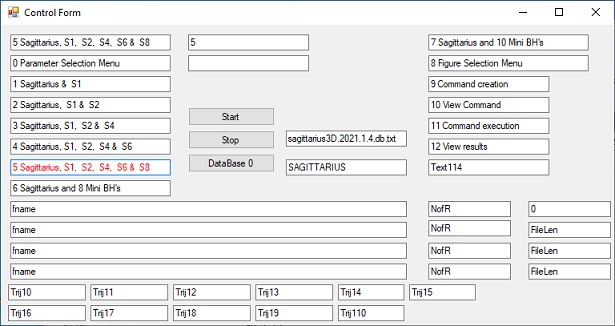 Display 1
|
The control form is used to select and perform a simulation or test.
- First select a particular simulation to be performed.
In the example this is simulation 5, which demonstrates "Sagittarius and 5 stars"
- Next Select "Parameter Selection Menu" in order to change cetain parameters relevant for this simulation. This is an option.
- Next Select Start
- Next the simulation will show the Display Form as shown in Display 2.
An additinal display shows the evolution of the simulation. See Display 3.
The control form is also use to select a certain number of pre-configured simulations or subtests.
The whole idea behind these simulations is to run these simulations over a long time period. These simulations can be temporary stopped and restarted at a later date. The intermediate results are stored on the disc
- First select a particular simulation to be created.
Select Menu Selection Form. Select SubTest and return back to Control form
- Select Command Creation. This will create a command file. After creating the parameters can be observed and modified by means of the Menu
- Next Select Command Excution
- This will start the simulation. The results are shown in the Display Form, as depicted in Figure 2
|
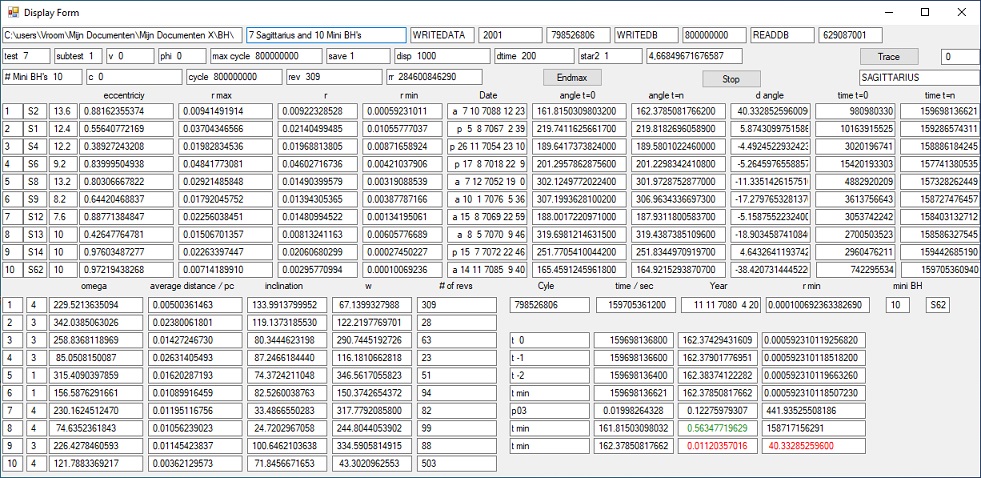
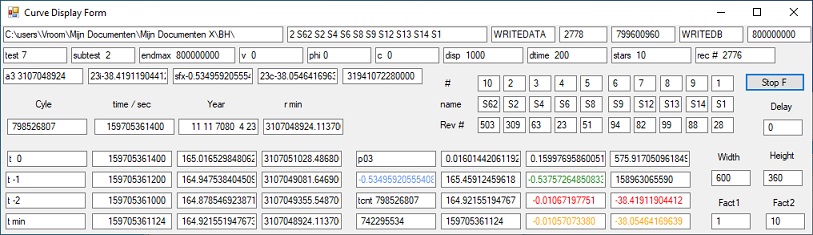
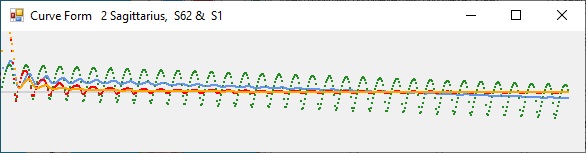
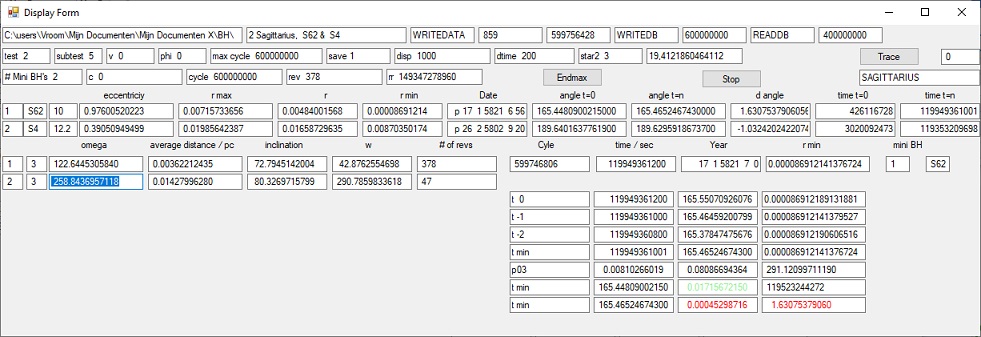
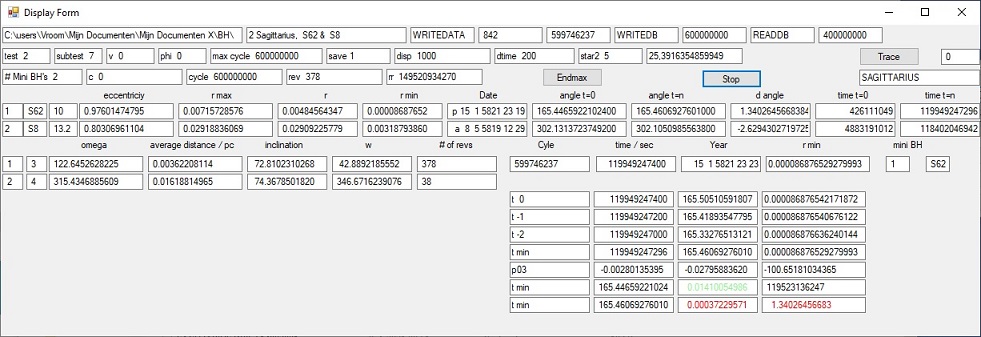
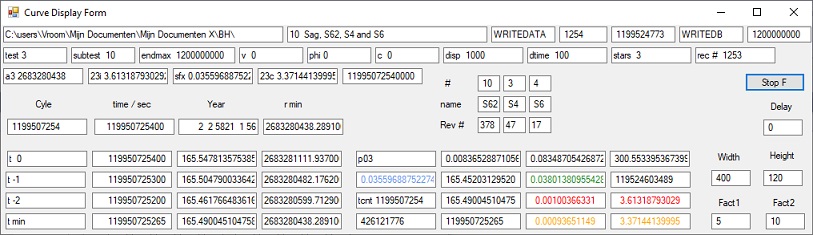
4. Display Form - Operation
 Display 2
|
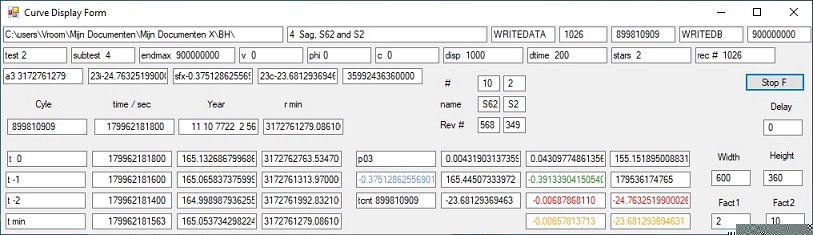
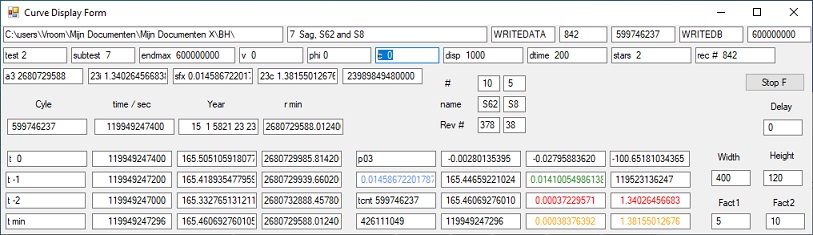
The Display Form is divided in 3 parts: A top header section, a middle section and a bottom section.
- The top header section which shows general information.
- The middle section shows information about 10 large stars, subdivided in 13 columns.
- The bottom section is divided into two parts:
- A left bottom section which shows more information about the 10 large stars, identified as the columns 14 to 20.
- A right bottom section which shows more detailed information about star #1, subdivided in 4 colums.
Now we go to something more specific data.
- In the header section the two most important parameters are the fields subtest and test at the beginning of line #2. The values are 1 and 7.
- The parameter subtest identifies the simulation number. There are a maximum of 16 simulations.
- The parameter test identifies the number of large stars included. Test #1 involves 2 stars. Test #7 involves 10 stars. For the full list see the Control Form
When the Display Form is selected the field subtest changes into 2 and the field test stays 7.
- In the middle section Column #2 shows the name of the large star. In line #1 this is stars S2.
When the Display Form is selected this changes into S1.
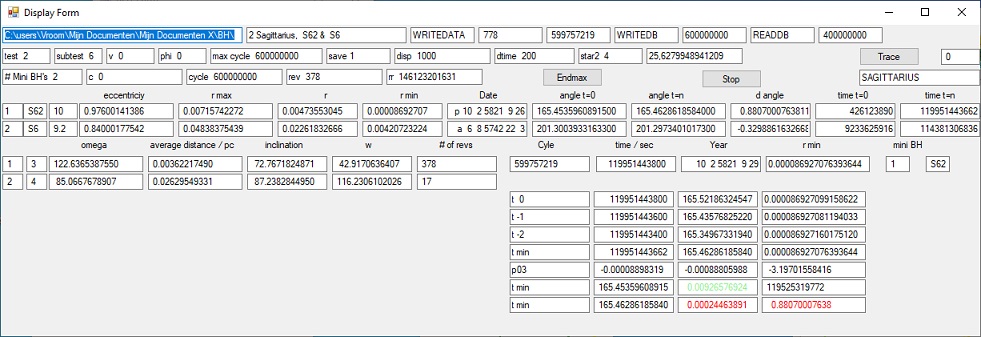
- Column #8 marked Date shows 10 dates. This shows the information the last time when the BH was either at aphelion (farthest distance) or at perihelion (closest) distance. For line 1, BH #1, S2, this is in the year 7088.
When Display 2 is selected you get a different image. Now line 1, BH 1, S62, this is in the year 7085.
- In the bottom section column #7 shows # of revs . This shows the total number of revolutions of the BH since the start of the simulation. The revolutions are counted based on the number of times when the star reaches perihelion.
For BH 1 this are 75 revolutions.
When Display Form is selected this changes to 14.
- The bottom box right shows a column marked Year. Specific of interest are the 4 values in the row starting with "t 0",
"t -1", "t -2" and "t min". This is the angle when the BH is at aphelion. Specific this is the longitude of the pericenter, W (Capital w), which is the sum of omega and w. w (small w) is the argument of the Pericenter.
In this particular case for BH 1 omega = 228 degrees and w = 293 degrees (See bottum left box) which gives a total of 521 degrees or 161 degrees, which is a good match.
The reason for using W in stead of w is because the original program was used to simulate the planets around the Sun.
- The column "time in sec" shows the time when the BH was perihelion. This was in cycle 1596981368/2=798490684, and 193597950. To calculate these numbers you have to divide the "time in sec" value by 200 which is delta time dt between each calculation cycle. This value is shown in the header behind dtime.
- Using the first three values at "t 0","t -1" and "t -2" it is possible to calulate the minimum distance which is shown in the row "t min".
For more technical detail about Display 2 select this link:
VB2019 Sagittarius program technical detail
 Display 3a - subtest1
|
|
 Display 3b - subtest2
|
|
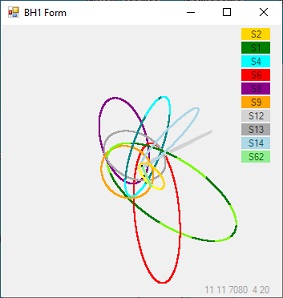
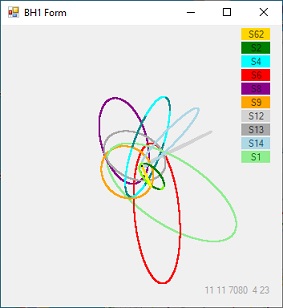
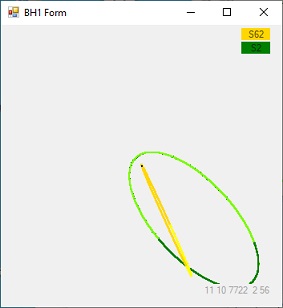
Both Display 3a and 3b show the same configuration. The center of the display shows the BH. lightWhen any is Display selected the configuration is enlarged with a factor 2.
The difference between the two is the order in which the positions of the stars are calculated.
- Display 3a shows the result of subtest=1. The first star that is calculated is S2 at the top of the list.
- Display 3b shows the result of subtest=2. The first star that is calculated is S62 at the top of the list.
The first star is the star at the top of the list and is shown in Yellow. The second star is shown in Green etc.
The first star is important when observing the Display Form. The bottom right section shows more detailed information specific about the first star.
The most remarqueble star is star S62. S62 circulates in roughly 10 years around the BH.
-
In Display 3A the star S62 is at the bottom of the list. When Display 3A is selected, S62 is the straight line in light green.
-
In Display 3B S62 is now at the top of the list and in Yellow. When Display 3B is selected, S62 is the straight line in yellow.
This is the starting configuration to observe the influence of all the stars specific towards S62.
The simulation is solely done using Newton's law.
When Display 2 is selected the top line shows S62. In that case the righthand side of the 10 lines on the bottom show detailed information ablout S62.
5. Menu Form - Operation
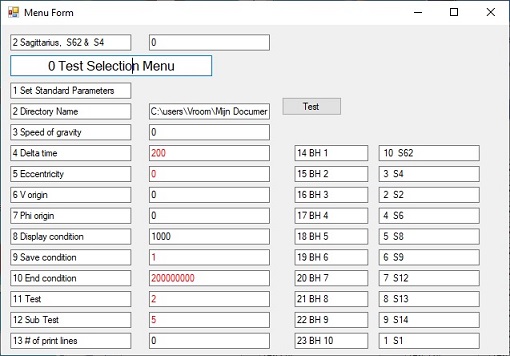 Display 4
|
6. Figure Form - Operation
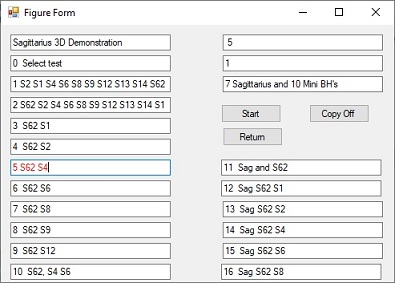 Display 5
|
The Figure Form is selected from the Figure Selection Field in the Control Form.
There are 16 standard Figures.
Figure 1 and Figure 2 each show all the 10 large stars.
The final result of Figure 1 is shown as Display 6b and the final result of Figure 2 as Display 7b.
The important difference between the two is, that in Figure 1, star #1 is S1 and in Figure 2, star #1 is S62.
That means that the bottom right section of the Display Form of simulation 1 shows the details of S1 and of simulation 2 shows thge details of S62.
Star 10, S62, is special because this star has the shortest revolution time (10 years) and comes the closests to the BH in the center of the Milky Way Galaxy. This star serves as a type of guidance or yardstick star for all the stars circulating around the center.
S62 will be influenced by all the other stars and that influence will be demonstrated for each of the other stars individualy. Simulation 2 or Figure 2 shows the combined influence of all the large stars on S62.
S62 can be compared with the planet Mercury in the solar system.
|
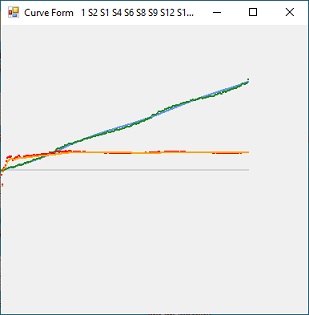
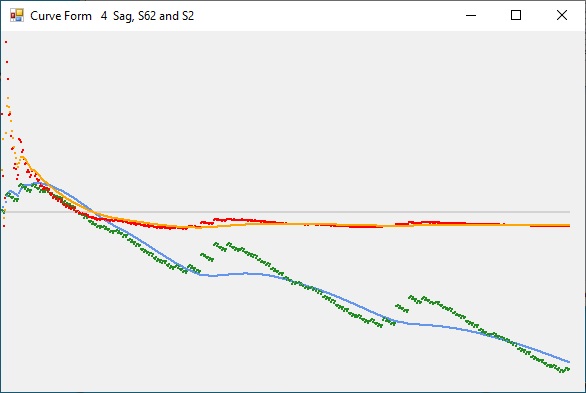
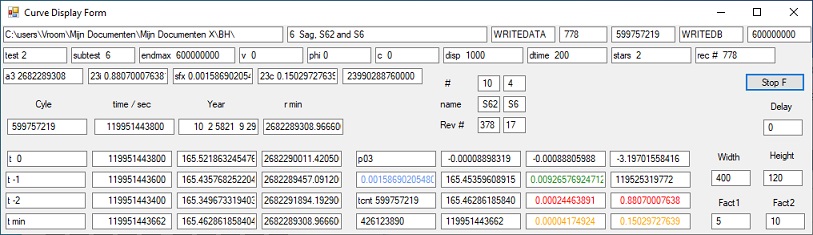
6.1 Curve Form - test 7 - subtest 1
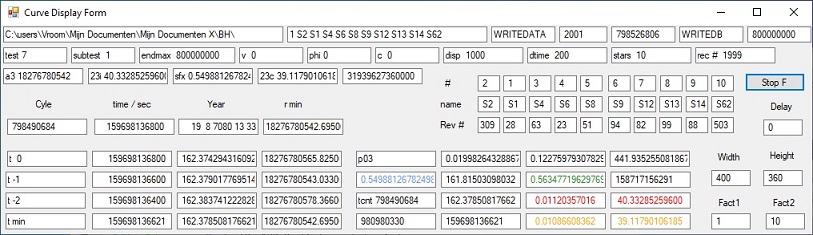 Display 6b
|
 Display 6b
|
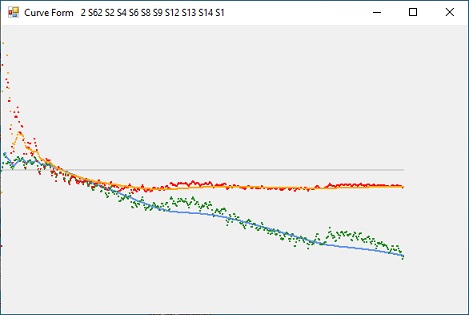
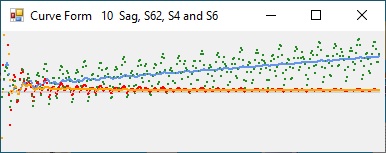
6.2 Curve Form - test 7 - Subtest 2
 Display 7a
|
 Display 7b
|
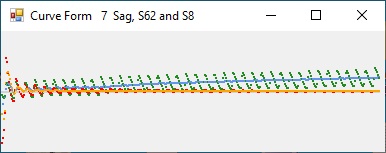
Display 7b shows the combined simulated influence of 'all' the large stars surrounding the BH in the center of the Milky Way on the movement the star S62
This star S62 services like a yardstick and an instrument to measure the behaviour of the surroundings of the BH Sagittarius A*.
The next paragraphs show the individual influence of each of these large stars
What makes this interesting is that each of these large stars is the source of a variable gravitational field, also called gravitational waves.
|
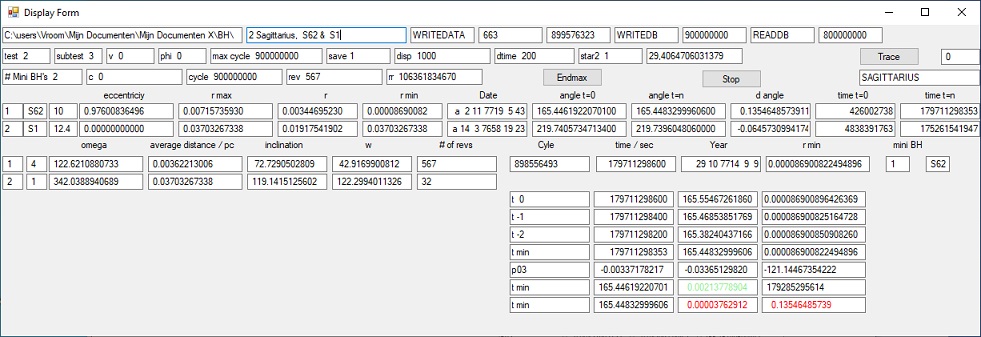
6.3 Curve Form - test 2 - Subtest 3
 Display 8a
|
 Display 8b
|
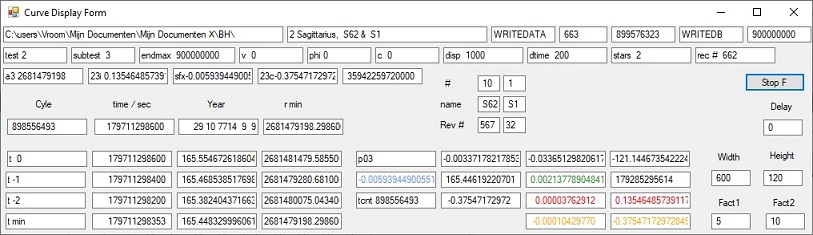 Display 8c
, specific the parameter Rev#, shows that during the time that S62 makes 567 revolutions BH S1 only makes 32 revolutions.
Display 8c
Display 8c, specific the parameter Rev#, shows that during the time that S62 makes 567 revolutions BH S1 only makes 32 revolutions.
|
 Display 8d
|
Display 8d shows the influence of S1 superimposed on the movement of S62.
The horizontal line shows the 567 times the position of S62.
At each position there 4 points: The green point and the blue point form one pair. The orange and the red point form a second pair.
The green points show the actual angle and the blue one the average actual angle.
The red points show the actual angle per unit of time and the orange points the average actual angle
|
To understand what is happening let us study Display 8b.
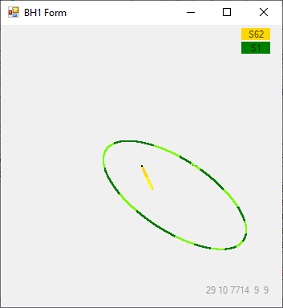
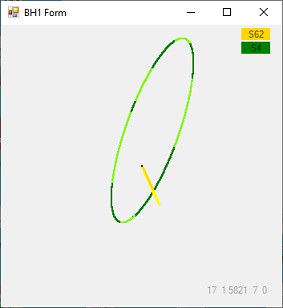
- At the center of the display there is a black dot. This is the position of a large BH called Saittarius A*.
- Almost connected to the Black is a Yellow line. This looks likes a yellow line, but it is not. It is a double line, an ellipse, which shows the path of S62.
- Around this small ellipse there is a marge larger ellipse which shows the path of the star S1. This path is divided in segments.
The logic behind these segments is that the color should change when S62 is at aphelion, or shortest distance.
- What is important that during one revolution the mutual attracting force between S62 and S1 continuous changes. This specific influences the angle of the direction of the shortest axis when S62 is at aphelion. For the longest axis when S62 is at perihelium this is also the case. The result is a wobble in the path of S62. The total number of wobbles depents on the number of revolutions S1.
6.4 Curve Form - test 2 - Subtest 4
 Display 9a
|
 Display 9b
|
 Display 9c
|
 Display 9d
|
Display 9d shows the influence of the star S2 on the star S62. It is important to observe that S2 makes 349 revolutions while S62 makes 568 revolutions.
Comparing Display 9d with Display 7d (which shows the influence of all star) shows that they are almost identical.
The reason is, that S2 is the closest companion with S62 and influences S62 the most. For more detail see: 7.3 Angular orbital elements
|
6.5 Curve Form - test 2 - Subtest 5
 Display 10a
|
 Display 10b
|
 Display 10c
|
 Display 10d
|
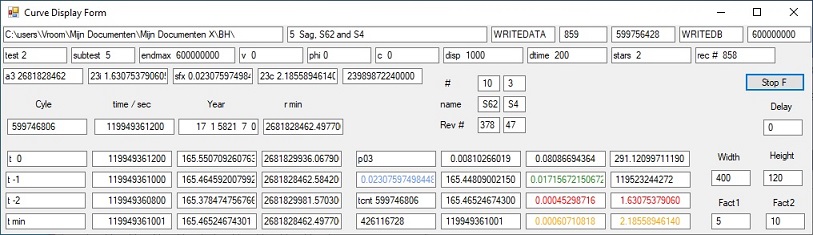
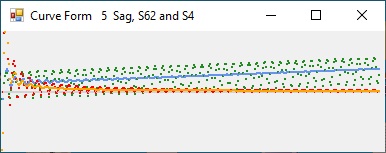
Display 10c shows the gravitational (rotational) influence of the S4 on the movement of S62. This rotational influence demonstrates the patern of a variable gravitational field (a gravitational wave) enforced by S4.
The parameter Rev # shows that when S62 has made 378 revolutions, S4 has made 47 revolutions or gravitational waves.
|
6.6 Curve Form - test 2 - Subtest 6
 Display 11a
|
 Display 11b
|
 Display 11c
|
 Display 11d
|
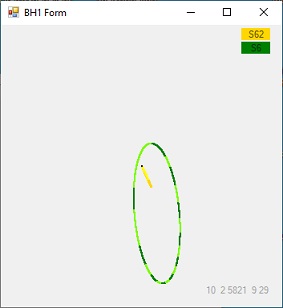
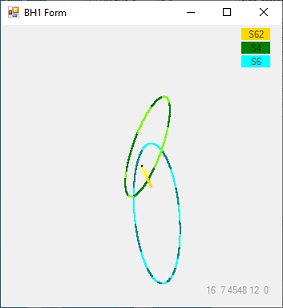
Display 11b shows the movement of the star S62, the yellow star, around the Black Hole in the centre.
Display 11b also shows the movement of the star S6, the green star, around the Black Hole in the centre and around S62.
Display 11c, the parameter Rev #, shows that during the 378 revolutions of S62 around Sagittarius A*, S6 makes 17 revolutions around Sagittarius A*.
Display 11d shows the influence of star S6 on star S62. The green path of S62 is the small ellipse.
|
6.7 Curve Form - test 2 - Subtest 7
 Display 12a
|
 Display 12b
|
 Display 12c
|
 Display 12d
|
Display 12d shows the influence of star S* on star S62. S62 shows 38 gravitational waves which demonstrates the 38 revolutions of S8 around Sagittarius A. At the same time S62 makes 378 revolutions around Sagittarius A. This is the same as in Display 11d.
|
6.8 Curve Form - test 3 - Subtest 10
 Display 13a
|
 Display 13b
|
 Display 13c
|
 Display 13d
|
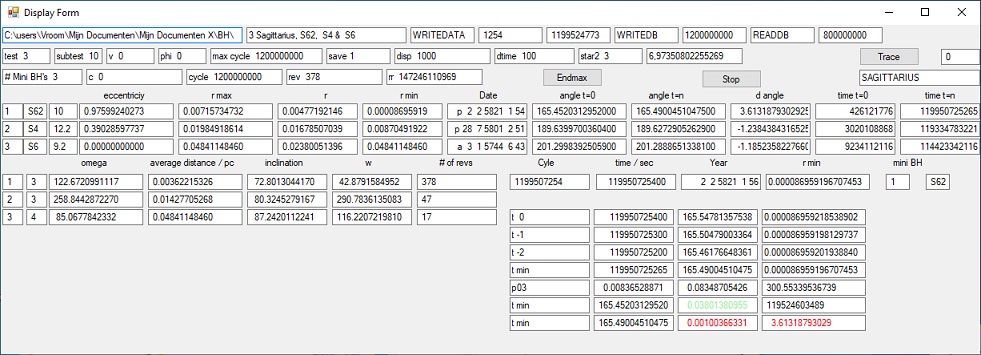
Display 13d shows the combined influence of the star S4 and the star S6 on the star S62.
Display 13d is a superposition of both display 10d and display 11d.
|
7 VB2019 Sagittarius Software Description
-
7.1 Source and destination
The program supports 1 BH in the center and 10 large stars. Together 11 objects.
The names of the of the objects are stored in the array BHname0$(0-10)
This array stores the names in a standard order from low (S1) to high (S62)
The numbers of BH's are stored in the array source(0-10). The standard order of these numbers are from 0 to 10.
-
7.2 Database
The VB2019 application supports 3 databases or files. The main reason is to save the results of a specific simulation and to allow to temporarely stop a simulation and to continue at a later date.
- A Command data base. This file contains only one record. The file contains the parameters of a simulation. The two most important parameters are Subtest and test
The two subroutines used are READCOM and WRITECOM. The filenames used end with CMn. The letter n identifies the subtest.
- A DATA file. This file contains only one record. The file contains all the parameters for all the objects, like position and velocity to continue with a simulation exactly in the same state where it was temporarily halted. The two subroutines used are READDATA and WRITEDATA
- A DataBase file. This file contains n records and is updated at regular intervals. The two subroutines used are READDB and WRITEDB
What is following is more specific information about the three files used.
- READCOM en WRITECOM use a BINARY file structure.
At the start of each subroutine the file is opened with: FileOpen(1,filenmcm$,OpenMode.Binary.
To read a record READCOM uses the statement FileGet(1,Comrecord
To write a record WRITECOM uses the statement FilePUT(1,Comrecord
At the end the file is closed with FileClose(1)
- READDATA en WRITEDATA use a Random file structure.
At the start of each subroutine the file is opened with: FileOpen(2,filenmou$,OpenMode.Random,,,ReclenDATA).
To read a record READDATA uses the statement FileGet(2,Datarecord, recordnumberou)
To write a record WRITEDATA uses the statement FilePUT(2,Datarecord, recornumberou)
At the end of each subroutine the file is not closed
- READDB en WRITEDB use a BINARY file structure.
At the start of each subroutine the file is opened with: FileOpen(3,filenmdb$,OpenMode.Binary.
To read a record READDB uses the statement FileGet(3,Bufrecord
To write a record WRITEDB uses the statement FilePUT(3,Bufrecord
At the end the file is closed with FileClose(3)
-
7.3 Angular orbital elements
The background is the book Explanatory supplement to the astronomical almanac paragraph 1.412 Orbital Parameters, page 27, specific Figure 1.412.1 Angular orbital elements.
In this section we use instead of large star the word planet.
In Figure 1.412.1 the path of the planet is an ellipse and drawn counter clock wise. This defines the the orbital plane. The Blackhole is at point M. The path results in 4 states:
- State 1 is the point N. This is point when the planet crosses the reference plane. There are two of these points (See state 3). The major characteristic of point N is that the distance towards the BH at point M (object 0) is decreasing.
Point N defines the parameter omega which has a value between 0 and 360 degrees.
- State 2 defines point P when the planet is at Perihelium or shortest distance from the BH
Point P defines the parameter w or the argument of Pericenter, which has a value between 0 and 360 degrees.
Point P also allows the calcultion of the inclination which has a value between -180 and 180
Point P is also used to calculate the minimum distance from the BH.
- State 3 is the point N'. This is point when the planet crosses the reference plane. There are two of these points (See state 1). The major characteristic of point N is that the distance towards the BH at point M (object 0) is increasing.
Point N' is not used to define omega.
- State 4 defines the point when the planet reaches Aphelium or the furtest distance from the BH.
Point P is also used to calculate the maximum distance from the BH.
When both the maximum distance and the minimum distance are calculated the eccentricity can be updated.
id1 a e i (�) omega w (�) Tp (yr) P (yr) Kmag q (AU) v (%c) dv m0 | #rev #rev*P
S1 0.5950 0.5560 119.14 342.04 122.30 2001,800 166.0 14.70 2160.7 0.55 0.03 12.40 | 28 4648
S2 0.1251 0.8843 133.91 228.07 66.25 2018,379 16.1 13.95 118.4 2.56 0.00 13.6 | 309 4975
S4 0.3570 0.3905 80.33 258.84 290.80 1957,400 77.0 14.40 1779.7 0.57 0.01 12.2 | 63 4851
S6 0.6574 0.8400 87.24 85.07 116.23 2108,610 192.0 15.40 860.3 0.94 0.00 9.2 | 23 4416
S8 0.4047 0.8031 74.37 315.43 346.70 1983,640 92.9 14.50 651.7 1.07 0.0 13.2 | 51 4743
S9 0.2724 0.6440 82.41 156.60 150.60 1976,710 51.3 15.10 793.2 0.93 0.02 8.2 | 94 4822
S12 0.2987 0.8883 33.56 230.10 317.90 1995,590 58.9 15.50 272.9 1.69 0.01 7.6 | 82 4838
S13 0.2641 0.4250 24.70 74.50 245.20 2004,860 49.0 15.80 1242.0 0.69 0.01 10. | 99 4851
S14 0.2863 0.9761 100.59 226.38 334.59 2000,120 55.3 15.70 56.0 3.83 0.06 10. | 88 4866
S62 0.0905 0.9760 72.76 122.61 42.62 2003,330 9.9 16.10 16.4 7.03 0.04 10. | 503 4979
|
- The values in the above table are from https://en.wikipedia.org/wiki/Sagittarius_A*_cluster
The values in column 13 are from https://arxiv.org/pdf/1708.06353.pdf
- Column 14 shows #rev, the number of revolutions of each star. The value are as shown in Display 2
- Column 15 shows #rev * P in years. They should be almost the same but they are not. The largest error is with the stars S1 and S2 which have the longest orbital period.
Reflection 1 - Overall evaluation of this simulation.
- What the result of the simulations shows is that first of all, the configuration is very stable over a period of roughly 5000 years.
- The gravitational field emitted from the large BH (Sagittarius A*) in the center of the Milky Way can be considered as static and is not very interesting.
- What is important are the the stars which circulate around Sagittarius A. As a result of these movement the distance between the stars fluctuates, which influences the gravitational force between these stars and which in turn influences the movement of the stars. One way to observe this, is by measuring the angle and distance when two stars are at its shortest distance from the BH Sagittarius A*. In the specific case of S62 and S1, it is S1 which influences S62. This can be measured by calculating as part of each cycle the distance between S62 and Sagittarius A*. The curve of the minimum distance demonstrates the shape of a gravitational wave.
- The gravitational field emitted from the center of the Sun is, from a physical point of view, even more interesting, because the Sun also rotates through the Milky Way.
Reflection 2 - Celestial mechanics of n stars
Celestial mechanics is the study of the movements of objects. In this reflection we study this in three steps: First we consider 2 objects (binary system), then 3 objects and finally with 10 stars. That means first we study the black hole with one star and secondly with 2 stars.
-
2 objects
In the case of Sagittarius A* we can consider 10 binary systems. All of these cases are similar. That means we have one BH which can be considered static in space. The BH creates a gravitational field which is also static.
For the star in each case this is different. The star moves through space and the path is an ellipse. The gravitational field caused by the star is not static but dynamic. At each point in space the strength of this field changes continuously, because the cause of this field i.e. the moving star changes continuously.
Using Newton's Law and assuming that the force of gravity acts instantaneous the binary system is stable.
-
3 objects
When 3 objects are involved we have one BH and 2 stars. In general any 2 stars can be selected, but in this project we take for star #1 S62 because this star has the shortest revolution time of roughly 10 years. That means every 10 years the star is at aphelion or shortest distance from the BH.
For star #2 we can take any star, for example S6 which has a revolution time of 192 years. That means when S6 performs 1 revolution, S62 performs roughly 19 revolutions. This in turn means that the force of gravity between S6 and S62 also changes during this 1 revolution. The best way to observe this is to save the position when S62 is at aphelion. Each time the distance to S6 and the force of gravity will be different, which will influence the position of S62. This pattern will be repeated each 192 years.
-
n objects
When n objects are simulated the gravitational influence of all the stars, including the BH is considered.
Reflection 3 - What happens if all the large stars are mini BH's?
My understanding is that there is no difference if all the large stars are baryonic matter or BH's, assuming that the masses will be the same. When all the masses are the same the force of gravity between all the masses will be the same.
But now we will go more in a more phylosophical direction. Starting point is that the movement of objects is a physical process. The fact that stable processes can be described by means of mathematics is not an explanation for this behaviour. The stable behaviour is more a result that these processes are not disturbed by anything.
As part of this discussion it is important to define the concepts: the present state, the past state and the future state of the universe. The present state could be a description of the position of all objects at the present. The past state is a description collected in a library of descriptions. All these descriptions are labelled: earlier descriptions. Using these descriptions it is in principle possible to predict the future. Such descriptions are called future descriptions.
My understanding is that at any moment every object is attracted by all the other objects in the universe. You could also claim different: each object attracts all objects in the universe. The most important issue is that this is true for both stars (which emit light) and BH's. The point is that stars can be observed and BH's cannot be observed, but that has nothing to do in the way these objects (vissible or invissible) attract each other or influence each other.
What is important that all the objects are influenced or attracted simultaneous but the cause is earlier. The cause is what is called gravity. Gravity acts by the emission of gravitons.
This can be rewritten as: at the present all objects are the (simultaneous) source of gravity but the moment each object influences or acts on each other object (in space) always happens at a moment in the future.
From a physical point of view a graviton is a invissible particle which transports gravitational energy. These particles are transmitted in sphere around the point of emission, which is considered at rest, within the one frame considered.
From a physical point of view each graviton travels from the point and moment of emission to a different point and moment where the graviton is captured, in a straight line.
Considering the Sun, the Earth and the Moon, each of these objects influences the other 2 objects and each object is influenced by the other two objects. There is no physical difference between these processes. The physical most interesting event is when the moon exactly, passes through a straight line between the Sun and Earth. That is called a solar eclipse
To explain this in more detail, it is important to agree upon that at every moment in time the Sun, the Earth and the Moon have a specific position in our 3D universe. That means at every moment in time there exists a line which connect the position of the Sun with the position of the Earth. What we want to know is when the Moon crosses this line i.e. the position of the Moon at this specific moment in time.
(Old text: However, and that is the most difficult part, that is not the point observed, strictly based on observations of the Sun and the Earth.)
Rewritten: However, and that is the most difficult part, neither of these 3 simultaneous events i.e. the actual positions at of this moment of the Sun, Moon and Earth can be observed from Earth, because all what we can observe are observations in the past.
In order to understand the physical reality, the most important are the physical positions of the objects, all reflecting the same moment in time and and not what we observe . That means the most important are the gravitons to describe the physical effects and not photons in order to observe the physical processes.
As of 25 July 2024 this text has to be modified.
Feedback
None
Created: 8 August 2020
Updated: 15 November 2020
Updated: 15 April 2021
Updated: 7 July 2022
Back to my home page: Contents of This Document