To answer these question the Excel program Friedmann's Equation.xls is used. The program simulates the Friedmann Equation.
To get a copy of the program and how to operate select: Operation Excel program friedmann's equation.xls & Copy
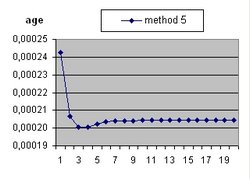
The age of the Universe is considered 14 billion years. This is also the value of parameter "age".
In order to simulate space expansion the Friedmann equation is used:
(See "Introducing Einstein's Relativity" by Ray d'Inverno. Equation 22.58 and 23.1
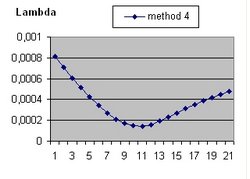
It should be understood that the parameter Lambda used in this document and the parameter Omega(Lambda) used in the Questions 11 and 13 are different parameters.
To understand the above equation better start from the first equation after : Friedmann equations - Wikipedia and replace both c and G with 1. You get than:
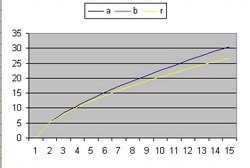
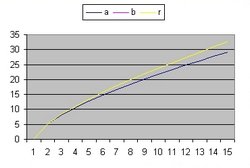
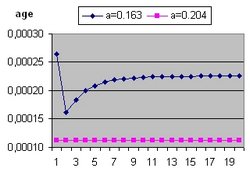
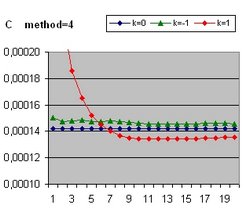
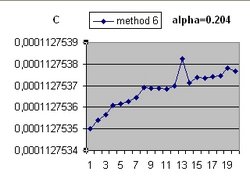
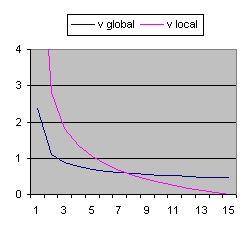
In addition to R(t) also two additional functions are implemented: a(t) and b(t)
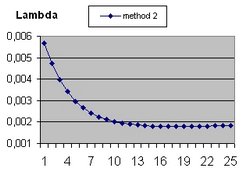
- The function a(t) is the function R(t) with Lambda = 0 and is implemented as:
- a(t) = a(t-1) * SQR( c/R ) * delta t
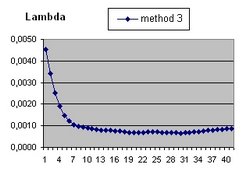
- The curve "b" is considered to simulate acceleration and is of the form:
- b(t) = b(t-1) * SQR( 1/3 * Lambda*R^2 ) * delta t
|
|
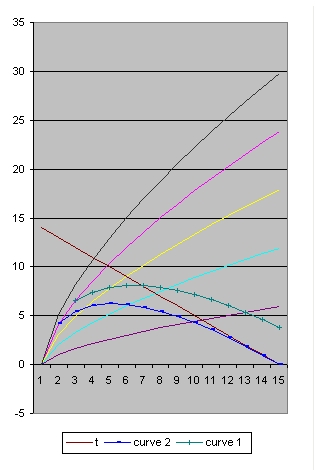
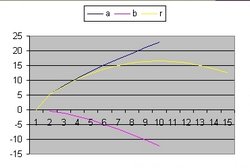
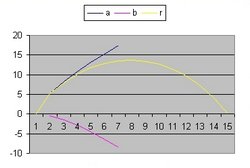
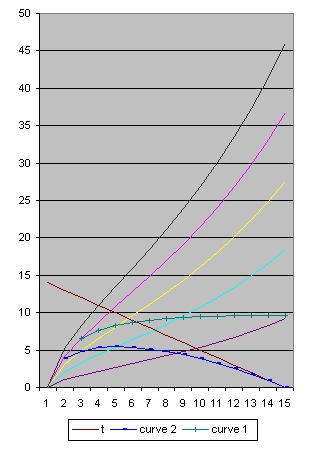
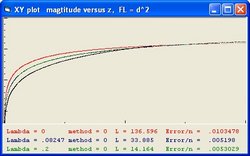
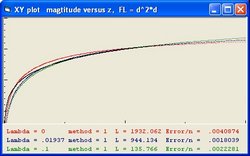
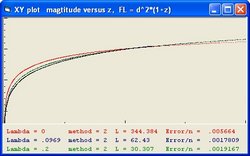
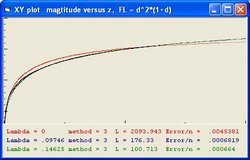
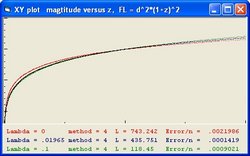
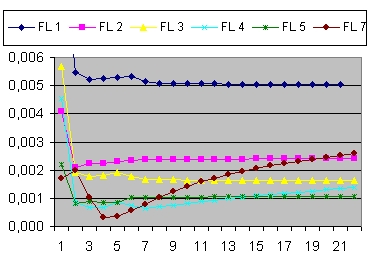
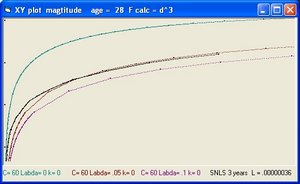
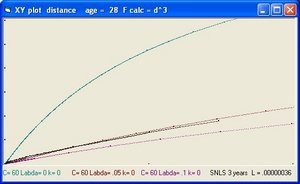
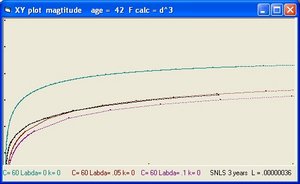
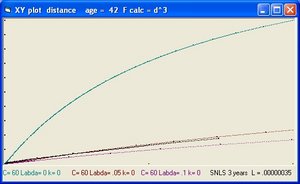
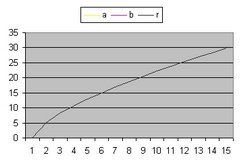
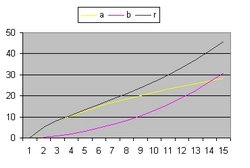
- The "Black" line is the function r(t). This function shows the total size of the Universe and is also called the 100% line.
- The "Yellow" line is the function a(t). This line shows the size of the Universe when Lambda = 0.
- The "Pink" line is the function b(t). This line shows the influence of the cosmological constant Lambda.